Debugging dotnet production problems
5 April 2010
On one of our current projects we are using Commerce Server 2007. The project is currently in its stabilizing phase and we were setting up the production environment. However, we were getting errors on both the acceptation and production server when importing the final commerce server product catalog. This is standard commerce server code, the only thing we did was import a product xml file, which was exported from another commerce server installation. The following is the error we got from commerce server:
“Line 2166: The filename, directory name, or volume label syntax is incorrect. (Exception from HRESULT: 0x8007007B)”
There was no additional error information, not in logs, not in the eventlogs, not anywhere. We enabled the exotic commerce server tracing and found nothing. Next to this, we were not able to reproduce this problem on our development machines. On those, the import would just succeed. When reading the error message, you would suspect some path to be invalid. There were no filepaths in the import xml, so this could not be the problem. So I fired up Windows Sysinternals Process Monitor to checkout errors in file activity, nothing standing out there. So at this point we had already spend a complete day trying to solve this problem, we were getting hopeless. We knew of windbg.exe, but this requires you to have the debug symbols and we didn’t have those for commerce server. Finally, we stumbled on mdbg.exe. This is a simple command line debugger, which makes it possible to debug .net applications from the command line. It doesn’t require symbols, because it can debug using Intermediate Language.
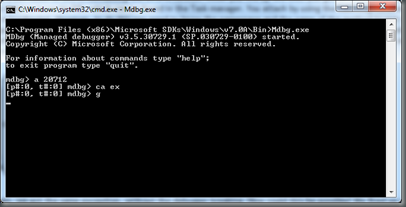
So we copied Mdgb.exe, MdbgCore.dll and MdbgDis.dll to the server, which can be found in the Windows SDK, normally under C:\Program Files (x86)\Microsoft SDKs\Windows\v7.0A\Bin. There is also a x64 folder in there, containing the 64 bits version. When you fire up the exe, you get an interactive command line debugger. To attach to a process, you need to know its PID, which can be found in the Task manager. You attach by using the following command: a <PID>. When you are attached, it is possible to set a breakpoint. However, to do this you need to know the namespace and the name of the method to put the breakpoint at. You will need reflector or ildasm to figure out at which method to put the breakpoint. In our case we figured an exception was being swallowed somewhere, so we only wanted to break at the exception. This is possible with the ca ex command, which makes the debugger break on every exception.
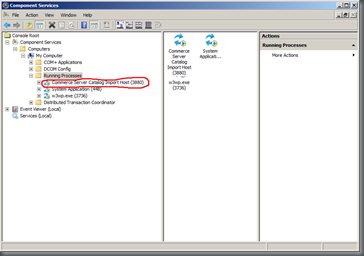
So at this point, we where attached to the IIS worker process of the commerce server webservices, we had the debugger break on exceptions, we were set to go. However, when we ran the import again, we got the same exception, without the debugger breaking. How could this be possible? We fired up reflector once more and when we looked at the source, we discovered that one of the .net components responsible for the import was a ServicedComponent. Meaning this was running in a separate COM+ application. So this part of the import .NET code was running in a different process. We would need to attach to this process as well. You can find the running COM+ processes and their PIDS in the Component Services tool (Administrative tools).
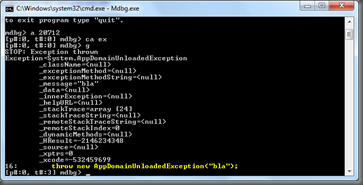
So we attached to this process as well, when we restarted the import the debugger did break on an exception. I don’t have access to a similar commerce server environment at the moment, so I’ll show how it looks when a random exception is thrown:
As you can see the debugger breaks because an AppDomainUnloadedException is thrown.
The exception we got in production indicated something went wrong when Commerce Server was creating scopes using Azman, which is a standard windows library for authorization. Using the p command, which prints all current variables to the debugger window, we could clearly see that this was only the case for a couple property definitions in our import xml file. After some investigation, we found out that all the property definitions that where failing had a name which ended with a whitespace. On our development machines we had disabled authorization for the commerce webservices, which is probably the reason we were not able to reproduce this problem on our development machines. After we fixed the property definitions the import succeeded, yeah!
So tooling like Mdbg.exe can be a lifesaver when you are diagnosing problems in a production environment.


